https://code.djangoproject.com/wiki/ProfilingDjango
http://ianozsvald.com/2012/03/18/high-performance-python-1-from-pycon-2012-slides-video-src/
Профилирование и отладка Python, инструменты
Django
django-extensions - this is a repository for collecting global custom management extensions for the Django Framework
python manage.py runprofileserver --use-cprofile --prof-path=/tmp/output
django-perftools
- QueryCountLoggingMiddleware - Perftools includes a logger that will monitor requests execution time. Once it hits the defined threshold, it will log to the named perftools logger, including the metadata for the request (as defined by Sentry's logging spec).
- RemoteProfilingMiddleware - Profiles a request and saves the results to disk.
- SlowRequestLoggingMiddleware - Logs requests which exceed a maximum number of queries.
django-profiler is util for profiling python code mainly in django projects but can be used also on ordinary python code. It counts sql queries a measures time of code execution. It logs its output via standard python logging library and uses logger profiling. If your profiler name doesn't contain any empty spaces e.g. Profiler('Profiler1') django-profiler will log all the output to the profiling.Profiler logger. @profilehook decorator uses profilehooks python package to gather code execution stats. Except it logs via standard python logging it also outputs code execution stats directly to sys.stdout.
from profiling import profile

@profile
def complex_computations():
    #some complex computations
django-processinfo - application to collect information about the running server processes.
dogslow - Dogslow is a Django watchdog middleware class that logs tracebacks of slow requests.
Python
line_profiler - is a module for doing line-by-line profiling of functions. kernprof is a convenient script for running either line_profiler or the Python standard library's cProfile or profile modules, depending on what is available.
runsnakerun - is a small GUI utility that allows you to view (Python) cProfile or Profile profiler dumps in a sortable GUI view. It allows you to explore the profiler information using a "square map" visualization or sortable tables of data. It also (experimentally) allows you to view the output of the Meliae "memory analysis" tool using the same basic visualisations.
dis - The dis module supports the analysis of CPython bytecode by disassembling it. The CPython bytecode which this module takes as an input is defined in the file Include/opcode.h and used by the compiler and the interpreter.
def myfunc(alist):
    return len(alist)

>>> dis.dis(myfunc)
  2           0 LOAD_GLOBAL              0 (len)
              3 LOAD_FAST                0 (alist)
              6 CALL_FUNCTION            1
              9 RETURN_VALUE
plop - Plop is a stack-sampling profiler for Python. Profile collection can be turned on and off in a live process with minimal performance impact.
statprof.py - This package provides a simple statistical profiler for Python.
pytrace - is a fast python tracer. it records function calls, arguments and return values. can be used for debugging and profiling.
WSGI
wsgi-shell - The 'ispyd' package provides an in process shell for introspecting a running process. It was primarily intended for investigating running WSGI application processes, specifically to determine what a process is doing when it hangs, but has many other features as well. This includes being able to start an embedded interactive Python interpreter session, set debugger probe points to record tracebacks for exceptions and then later run 'pdb' in post mortem mode on those exceptions.
Linux
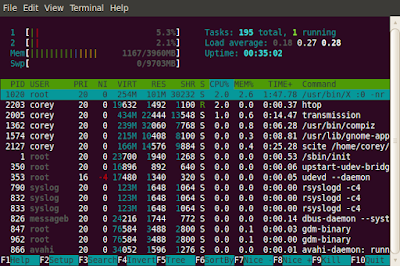
top -H
1 - нагруженность цпу
С - сортировать по цпу
М - сортировать по памяти
к - прибить процесс
с - показать путь к комманде
vmstat - выдает информационный отчет о активности процессов, памяти, свопинга, поблочного ввода/вывода, прерываний и процессора
w - кто зарегистрирован и что они делает
free – использование памяти
pstree - процессы в виде иерархии
ps
ps -u someusername -o pid,%cpu,%mem,start_time,size=-size-,state,cmd
ps -u someusername -o pid,%cpu,%mem,start_time,size=-size-,state,comm | grep runfastcgi.fcgi
Disks usage
df -h


